Smarter Balanced Tests—One Year Later, Same Shameful Tests
In March 2015, SR Education Associates released a scathing report of the quality of the Smarter Balanced tests for mathematics used by 17 states to measure student proficiency with respect to the Common Core State Standards for Mathematics. We found that the quality of the tests was so bad that they should have been removed from use before they were ever administered. Of course, they were not. While hundreds of thousands of parents and students, aware of the shortcomings of these tests and dismayed by the relentless testing their children were being subjected to, took the matter into their own hands and opted out of the testing, more than 90% of students in Smarter Balanced states took the test as planned.
Of course, when the results of the Smarter Balanced tests were announced in the late summer and fall of 2015, the results were entirely predictable: In state after state, the majority of students failed to meet the standard the state set for students. In California, for instance, the state where 3 million students in grades 3 to 8 and grade 11 took the tests, 38% received a score of 1 (Standard Not Met), 29% a 2 (Standard Nearly Met), 19% a 3 (Standard Met), and 14% a 4 (Standard Exceeded). When disaggregated by race/ethnicity, the results were even more troubling: Only 16% of African-American students, 21% of Hispanic students, and 22% of American Indian/Native Alaskan students either met or exceeded the standard set by the state. Of course, the state reported that “Economically Disadvantaged” students did poorly as a group (21% met or exceeded the standard) and “English Learners” did worse than any group (only 11% met or exceeded the standard).
Scores on the Smarter Balanced tests were sent to parents across the country. Parents of failing students were devastated. Many states faced a public relations crisis and a few Smarter Balanced (and PARCC) states abandoned the tests because of the political pressures the poor results created. Public pressure state to state varied because each state set their own cut scores to define proficient.
What part of the high rate of failure, however, was due to inadequate student knowledge in mathematics and what part of the failure was due to the poor quality of the questions asked and the convoluted and confusing test interface designed by the test makers. Unfortunately, we will never know.
The March 2015 SR Education Associates report accurately predicted this dilemma. While I have seen no studies released that examine the degree to which the Smarter Balanced online tests themselves contributed to the devastating student results, several analyses of the PARCC test results substantiated our prediction that poor computer test design could contribute significantly to poor test results. (See https://www.washingtonpost.com/news/education/wp/2016/02/04/report-kids-who-took-common-core-test-online-scored-lower-than-those-who-used-paper/ and http://mobile.edweek.org/c.jsp?cid=25919761&bcid=25919761&rssid=25919751&item=http%3A%2F%2Fapi.edweek.org%2Fv1%2Few%2F%3Fuuid%3D6D674BE0-CA7F-11E5-A935-71C9B3743667&cmp=SOC-SHR-TW) And the students that are penalized the most by the shoddy tests are struggling students who have the least access to computers and who are the most vulnerable in their mathematical self-esteem. Given the findings of our report on the Smarter Balanced tests, it is our firm belief that an examination of the results from Smarter Balanced would mirror the findings on PARCC: A substantial factor in the failure of many students on the Smarter Balanced tests in 2015 was poor test design and implementation. The poor craft of the tests invalidates all results.
Has the situation gotten any better in 2016? Unfortunately, not. Is there any chance that the Smarter Balanced tests will get better in future years? The answer is “No” again.
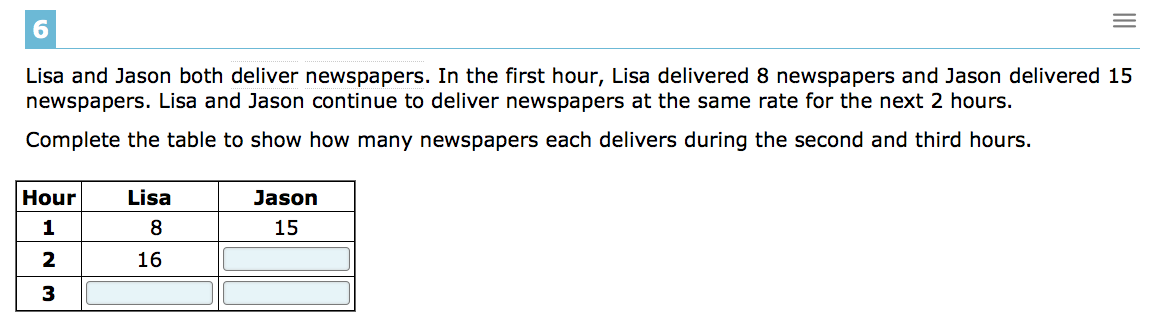
After the 2015 tests were administered, McGraw-Hill, the developers of the Smarter Balanced tests sold their CTB/McGraw-Hill testing division to Data Recognition Corporation and laid off most of the staff that had worked on the tests. As we stated in our report, “In the current political climate, there will not be funding available for those who could fix them to actually fix them.” McGraw-Hill, having profited handsomely from their contracts to develop the tests, bailed out before they were held responsible for the disaster they created. In the year since we released our in-depth report, Smarter Balanced has improved their website design, rolled out a big public relations campaign to convince parents of the virtues of the test, but they have done little or nothing to improve the tests themselves. Before writing this blog post I took several of the 2016 practice and training tests available on the Smarter Balanced site. While different problems have been pulled from the testing data bank to offer up as items on these practice tests, the new items suffer from the same terrible design as the 2015 items. It didn’t take long to come across the problem below on the high school math training test:
Never mind the ridiculous context of the problem—a paper route sustained in 2016 by delivering 8 papers per hour—focus instead on the partially filled in table placed by the test authors. The problem states, “Lisa and John continue to deliver newspapers at the same rate for the next 2 hours.” The question asks, “Complete the table to show how many papers each delivers during the second and third hours.” The answer is simple: During the second hour they will deliver 8 and 15 papers respectively, and during the third hour they will deliver 8 and 15 more papers. But the first entry in the table has been filled in as 16 by the test author. Didn’t they read their own question? 16 is the cumulative number of papers that will be delivered by Lisa in the first two hours, not the number that she’ll deliver in the second hour!
Welcome to the 2016 testing season. Parents and students, prepare to opt out—again.

